The phi (φ) factor transition in ACI 318-19: Grade 60 vs Grade 80
The strength reduction factor φ is not a constant for columns: ACI 318-19 Table 21.2.2 moves it from 0.65 (tied columns; 0.75 for columns with a conforming §25.7.3 spiral) to 0.90 as the section's net tensile strain εt grows — the code's reward for ductile behavior. What changed in 318-19 is where that ramp starts and ends: the limits are now Grade-dependent, so the same strain state can carry a different φ for Grade 60 and Grade 80 reinforcement. This page compares the two side by side.
The formula (tied columns)
For columns with a conforming spiral (§25.7.3 — in calcnote's scope for circular sections since 2026-09), the same ramp runs from 0.75 with a 0.15 slope; the charts on this page show the tied ladder, and the Grade-dependence works identically for both.
with the yield strain defined from the grade itself:
So the transition zone is always 0.003 of strain wide, but it slides with the grade: Grade 60 ramps from 0.00207 to 0.00507, Grade 80 from 0.00276 to 0.00576. Higher-grade steel must be stretched further before the code treats the section as tension-controlled.
The two ramps, plotted
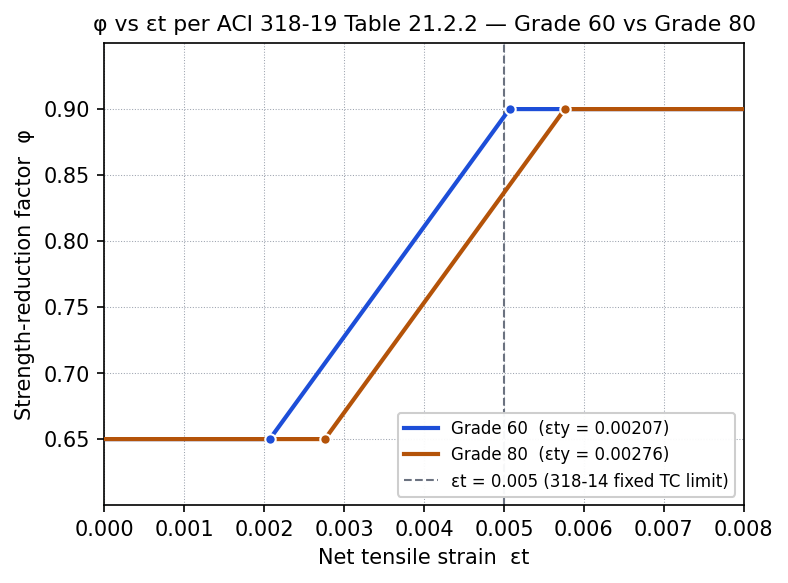
φ at matching strains: Grade 60 vs Grade 80
| εt | φ (Grade 60) | φ (Grade 80) | |
|---|---|---|---|
| 0.002 | 0.650 | 0.650 | |
| 0.00207† | εty Gr 60 — ramp start | 0.650 | 0.650 |
| 0.00276† | εty Gr 80 — ramp start | 0.708 | 0.650 |
| 0.004 | 0.811 | 0.753 | |
| 0.005 | 318-14’s fixed TC limit | 0.894 | 0.837 |
| 0.00507† | TC limit Gr 60 — ramp end | 0.900 | 0.843 |
| 0.00576† | TC limit Gr 80 — ramp end | 0.900 | 0.900 |
| 0.007 | 0.900 | 0.900 |
† the structural breakpoints of each ramp, with strains shown rounded to five decimals. φ in every row is evaluated at the tabulated strain using the exact yield strains εty = 60/29,000 and 80/29,000.
The highlighted row is the one worth memorizing. Under 318-14, εt = 0.005 was the fixed tension-controlled limit for every grade — φ = 0.90 exactly there. Under 318-19 the Grade-60 ramp doesn't finish until 0.00507, so the same strain now gives φ = 0.894, and Grade 80 — still deep in its transition — gives 0.837. Same strain, different φ: the grade now matters at every point of the transition band.
Worked example: mid-transition
Take a Grade-60 section whose extreme tension layer reaches εt = 0.00357 (= εty + 0.0015, the exact midpoint of the ramp):
A useful property of the formula: at the same offset above yield, φ is grade-independent — εty + 0.0015 gives 0.775 for Grade 80 too. Grades diverge only when compared at the same absolute strain, as in the table above. To see where a strain state like this comes from, the interaction-diagram walkthrough derives εt from the neutral-axis depth on a real 16×16 in section.
Why 318-19 abandoned the fixed 0.005
318-19 was the edition that brought Grade-80 (and, for some members, Grade-100) reinforcement into general use, and a fixed strain threshold doesn't measure ductility consistently across grades: 0.005 is about 2.4× the yield strain of Grade-60 steel but only about 1.8× that of Grade 80. Anchoring the limits to εty restores the same margin-beyond-yield for every grade. The shift is small but real for Grade 60 — about 0.7% at operating points near the old limit — and it is one of the documented reasons published 318-14-era references don't reproduce exactly under 318-19; see the edition note on our Wight Example 11-4 verification page, where exactly this difference appears in a published textbook comparison.
What calcnote does
calcnote applies the 318-19 formula without approximation, using the exact εty = fy/Es for the selected grade at every point of the interaction diagram — the chart above is generated by the same function the engine runs. To see φ applied to your column's capacity, the live sample calc shows the resulting φPn / φMn operating point with no signup.
Sources
- ACI 318-19: Table 21.2.2 and §21.2.2.1–.2 (φ from net tensile strain), §21.2.2 commentary R21.2.2 (grade-consistent ductility rationale), Table 20.2.2.4(a) (Grade-80 deformed-bar use).
- ACI 318-14: §21.2.2 (the superseded fixed 0.005 tension-controlled limit).