How to construct a column interaction diagram per ACI 318-19
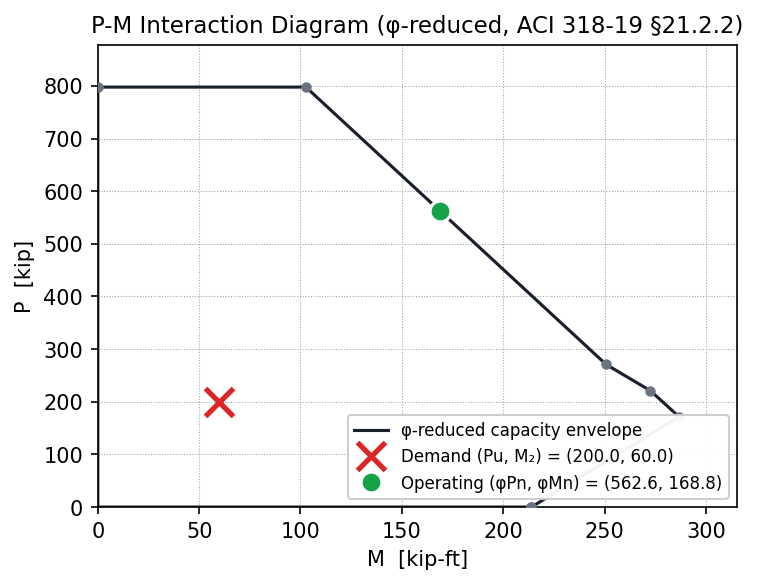
A P-M interaction diagram is built one point at a time: pick a neutral-axis depth, work out the strains, turn them into forces, and sum. This page walks that construction end-to-end on a real section — a 16×16 in tied column with 8-#9 bars — deriving three of the seven control points in full and tabulating the rest. The same section's results are cross-checked against four independent authorities on the verification page; here the focus is the mechanics.
The example section
| Section | 16 × 16 in (Ag = 256 in²) |
| Reinforcement | 8-#9, two-face layout → 4 bars at d = 2.5 in, 4 bars at d = 13.5 in (Ast = 8.00 in²) |
| Materials | f′c = 5,000 psi, Grade 60 (Es = 29,000 ksi) |
| Derived constants | β1 = 0.80 · εty = 60/29,000 = 0.00207 · tension-controlled limit εty + 0.003 = 0.00507 |
The recipe
Every point on the curve comes from the same five steps, anchored in two assumptions: plane sections remain plane (strain varies linearly through the depth, with the extreme compression fiber at the crushing strain εcu = 0.003), and concrete stress is represented by the Whitney stress block.
- Pick a neutral-axis depth c. Each c is one point on the curve.
- Strains by similar triangles: each bar layer at depth d gets ε = 0.003·(c − d)/c.
- Stresses: fs = Es·ε, capped at ±fy. Bars inside the stress block get a net contribution of As·(fs − 0.85·f′c) — the concrete they displace is already counted in the block.
- Forces and moments: concrete block Cc = 0.85·f′c·a·b with a = β1·c; sum axial forces for Pn, sum moments about the section centroid for Mn.
- Apply φ from the net tensile strain at the extreme tension layer per Table 21.2.2 (0.65 compression-controlled → 0.90 tension-controlled).
Worked point 1: the axial cap (φPn,max)
The top of the usable diagram isn't a strain-compatibility point at all — it's the code's accidental-eccentricity ceiling. Pure-compression capacity first (§22.4.2.2):
Then the tied-column cap (§22.4.2.1, with φ = 0.65):
On the diagram this is the horizontal line truncating the top of the curve.
Worked point 2: the balanced point
At the balanced point the concrete crushes exactly as the extreme tension steel reaches yield. Similar triangles fix c directly:
Forces, layer by layer:
Moments about the section centroid (block arm 8 − 6.39/2 = 4.805 in; both bar layers at 5.5 in):
εt = εty means compression-controlled, so φ = 0.65: φPn = 270.9 kip, φMn = 250.8 kip-ft.
Worked point 3: the tension-controlled limit
The strain state where φ first reaches 0.90 — the endpoint of the transition zone. Same similar triangles, new target strain:
With εt = 0.00507 the section is tension-controlled, φ = 0.90: φPn = 171.6 kip, φMn = 286.8 kip-ft. Notice the reward for ductility — φ jumped from 0.65 to 0.90 between the last two points.
All seven control points
| Point | c (in) | φ | φPn (kip) | φMn (kip-ft) |
|---|---|---|---|---|
| Cap φPn,max (worked above) | — | 0.65 | 797.7 | — |
| fs = 0 at extreme tension bars | 13.50 | 0.65 | 622.3 | 169.9 |
| fs = 0.5·fy | 10.04 | 0.65 | 421.9 | 220.1 |
| Balanced point (worked above) | 7.99 | 0.65 | 270.9 | 250.8 |
| Tension-controlled limit (worked above) | 5.02 | 0.90 | 171.6 | 286.8 |
| Pure bending (Pn = 0) — c found iteratively | 3.25 | 0.90 | 0.0 | 214.0 |
| Maximum tension Pnt | — | 0.90 | −432.0 | 0.0 |
These values are computed by calcnote's engine and cross-checked against StructurePoint's spColumn-validated table, Wight's Example 11-1, and an independent first-principles baseline — agreement ≤ 0.03% on the directly-tabulated points.
The finished diagram
Sources
- ACI 318-19: §22.2 (strain-compatibility assumptions, Whitney block §22.2.2.4.1, β1 §22.2.2.4.3), §22.4.2.1 (design cap, Table 22.4.2.1), §22.4.2.2 (Po), Table 21.2.2 (φ).
- Cross-check references: StructurePoint, "Interaction Diagram — Tied Reinforced Concrete Column Design Strength (ACI 318-19)" (May 2022); Wight, Reinforced Concrete: Mechanics and Design, 7th ed., Example 11-1.